Forecast Earthquake Details
Forecast Earthquake Details
Tonga M 8.1 +/- 0.1
Forecast revised UTC 6:30 hrs on 06/10/25: from the latest events and new modelling this M8.1 is not expected until Oct 30 +/-2 days within 300 km of Tonga’s capital, Nuku’alofa (Lat -21.134 Lon -175.200).
(See the Google Earth Pro map below).
(Also see Disclaimer and note that all times are UTC).
Cascadia Subduction Zone
Oregon & Northern CA
M 7.9-8.2 about Dec 4, 2025 (UTC).
Expected at the southern end of the Cascadia Subduction Zone between mid Oregon and Cape Mendocino, Northern California, or at the northern end of the San Andreas Fault system.
Santiago, Chile
M 7.4 on about Dec 12, 2025. Forecast downgraded Sep 12 from M7.8 - 8.0 previously expected on Nov 24.
Kathmandu, Nepal
M 8.0 on about Jan 3, 2026.
Colima, Mexico
M 8.0 on about Jan 7, 2026.
San Diego region, CA, USA
M 7.2 about Apr 13, 2026.
Northern Türkiye
M 7.6 possibly within 250km of Istanbul, about May 2026.
NOTE: Our most recent successful prospective forecast was for the M_7.0 Cape Mendocino event on Dec 5, 2024, whose magnitude and date were forecast exactly and advised ahead by email to several people, including a seismologist in CA. It was also noted correctly, that the event would most likely occur within 150_km of the Cape.
PLEASE ALSO NOTE:
NO ATTEMPT IS MADE TO FORECAST ALL IMPORTANT SEISMIC EVENTS. Nor does the author claim to know about all upcoming earthquakes.
Forecasts may change as the latest seismic events are incorporated into the models (see Disclaimer).
TONGA: A major M 7.0 suspected 'foreshock' occurred on Mar 30 this year, and only some 14 km SE of the previous M 8.0 in 2006. This possible foreshock is also shown on the Google Earth Pro map below.
The official position is that this M_7.0 cannot be determined as a foreshock until after the mainshock has occurred. The USGS says that “Foreshocks are earthquakes that precede larger earthquakes in the same location. An earthquake cannot be identified as a foreshock until after a larger earthquake in the same area occurs.” [Foreshocks, aftershocks - what’s the difference? | US Geological Survey.]
However, according to this new ecological theory and a wide regional approach to forecasting, principal 'foreshocks', not defined as above, but rather as regional seismic events which are about one magnitude less than a subsequent mathematically-determined mainshock are potentially identifiable, often up to a few years ahead of the mainshock. Thus, with reference to Fig. 1, at the end of 2022 the mainshock model was already forecasting a M_7.85 , and by the end of 2024 this model was forecasting an approximate M_8.1 mainshock, which timing models expect this year, 2025.
With this above scenario, it was expected and not surprising to have a M_7.0 ‘potential foreshock' in March this year, only some 14_km SE of the previous mainshock of M_8.0 in 2006.
The worldwide mainshock model (determined mathematically from a hundred sequences of annual seismic events like that shown in Fig. 1) forecasts a magnitude (M) 8.1 mainshock, but now the big question is When? Later this year, or next year?
Only long-term models for the yearly timing of largest seismic events can provide the answer – if it is indeed the correct year for the expected mainshock, then the following short-term models come into play.
These short-term timing models are based on lunar monthly, and also weekly patterns and daily models, which are updated regularly as new seismic events occur. Then, triangulation between various models (based on the important arithmetic, algebraic, and geometric parameters of the timing models) answers the question of ‘when’ to within plus or minus one day of the main event in 95% of cases.

*This kind of graph is closely similar in format and concept to those of my previous career as an insect ecologist where, instead of the largest earthquake in a given time period, I was studying the maximum abundance of certain insect species each year as a result of different pasture grazing management practises. This simple approach led to a worldwide breakthrough which overturned conventional thought and expectations and made it possible to understand several previous conundrums in the dynamics of pasture pest problems throughout the world.
Well might you have asked: ‘What have insects to do with earthquakes?’ Nothing. and ‘What have earthquakes to do with insects?’ Nothing. Certainly not in this context here. But the ways an ecologist might go about modelling their population dynamics and features of their ecology are very similar.
Previous retrospective forecast for M_8.0, 2006
This new ecological forecasting model gave the exact magnitude and date (May 3) for this event which was expected within 250 km of Pangai, Tonga. It occurred only 45 km SE of Pangai.
*If not stated otherwise, all earthquake data for the research and forecasts shown in this website were derived from the United States Geological Survey (USGS), and all times and dates are UTC.

Fao Island, Tonga (Photo credit: beach-on-map.com)Further information regarding the M 8.0 event of May 3, 2006, -is available on the USGS network: M 8.0 - 47 km SSE of Pangai, Tonga: “At the location of the earthquake, the Pacific plate subducts westward beneath the Australia plate at a velocity of about 77 mm/yr”. This USGS site also says that a tsunami with wave height of 0.54 metres hit at Pago Pago, and that this peak was also reached at Crescent City, California. Fortunately, no loss of life was recorded, and only one person was injured.
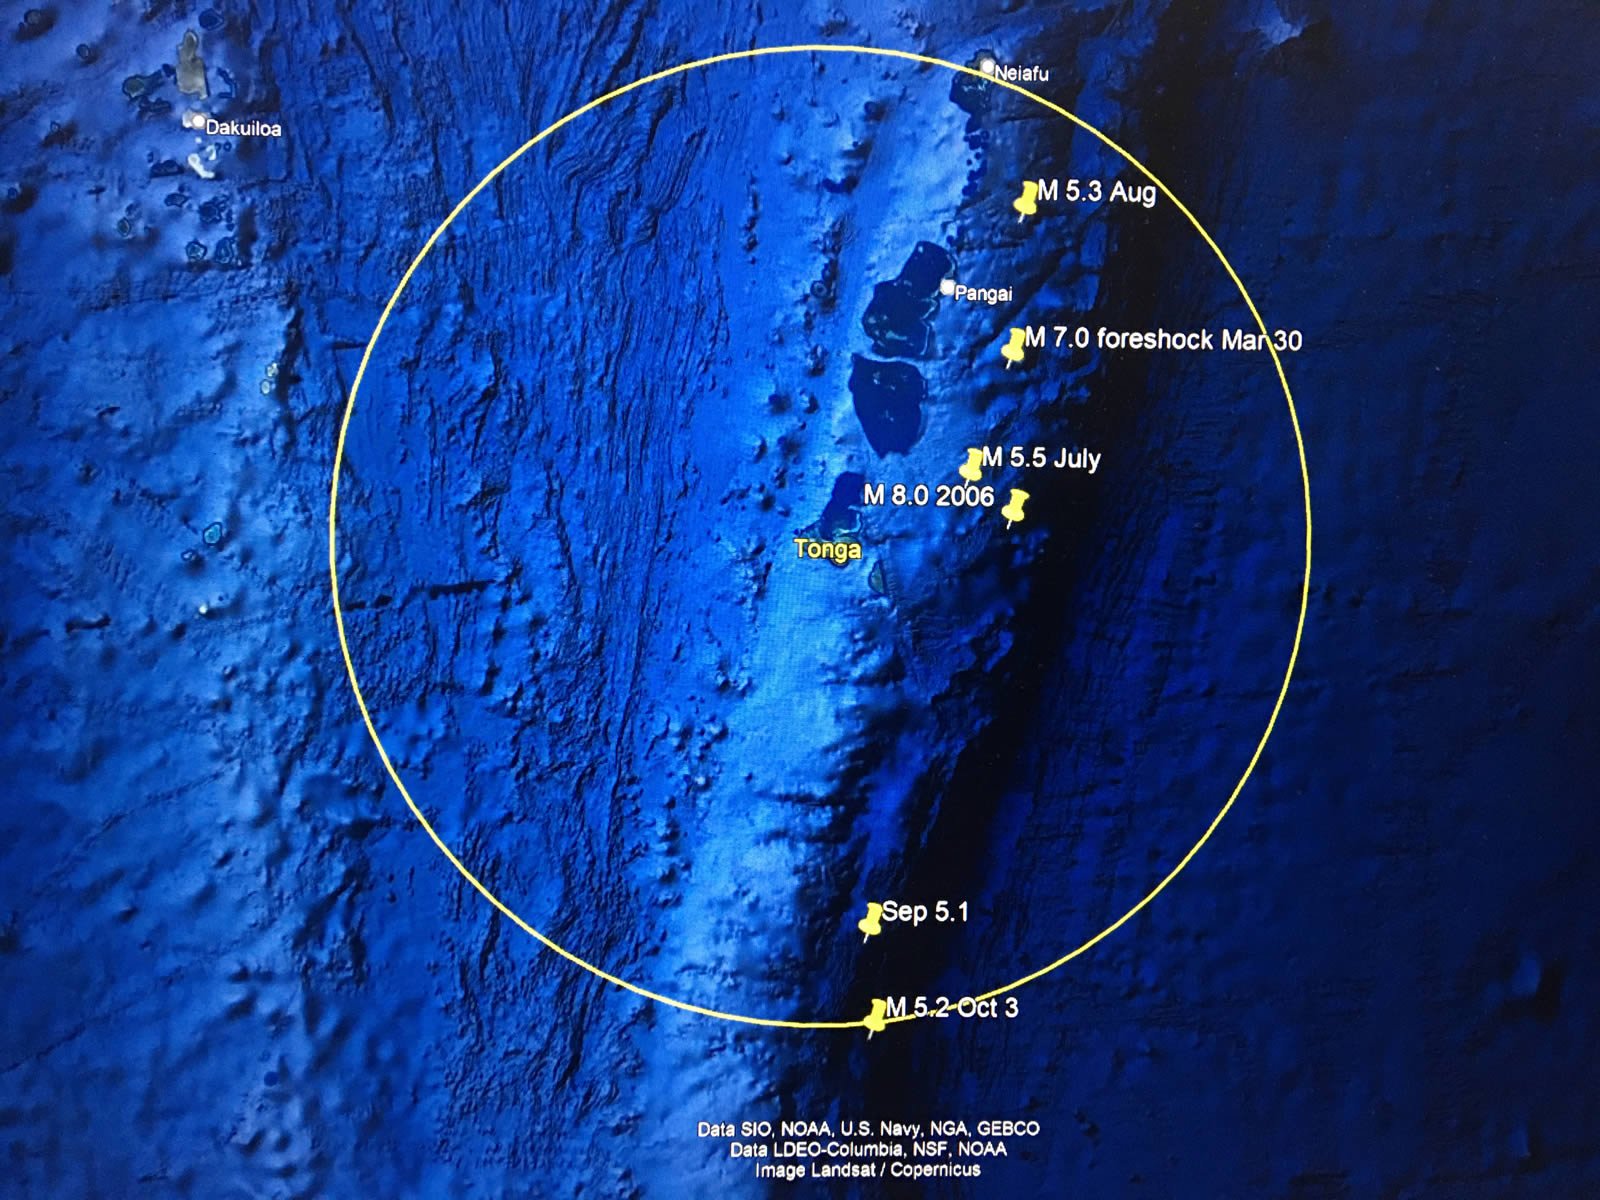
Google Earth Pro map (updated 08/10/2025) showing a M 7.0 ‘foreshock’ to a forecast M 8 which is now not expected until about Oct 30, 2025, within a radius of 300km from Nuku’alofa, Tonga (yellow circle); the map below also shows the relative positions of Tonga’s 2006 M 8.0 earthquake and the largest recent monthly events to Oct 3.
Data derived from https://earthquake.usgs.gov/earthquakes/map/