
Djibouti & “Afar Triangle”
a cradle of human evolution
Head of vast continental rift
THIS PAGE IS NOW BEING EDITED
〰️
THIS PAGE IS NOW BEING EDITED 〰️
Overview of the 'Afar Triangle' Region
The 'Afar Triangle' is a region marked by significant seismic activity, where annual earthquake events are meticulously monitored and analysed by scientists to better understand the underlying geological processes driving this activity.
The Afar Triangle, also known as the Afar Depression, appears visually as a light grey triangular area (see figure 2) at the head of the expansive 3,000-kilometre East African Rift. This rift enters the Afar Depression at its southwest corner, forming a prominent geological feature in the region.
Today, the Afar Depression holds the distinction of being the hottest place on earth for year-round temperatures. Historically, it may have been the cradle of humanity, but it is now recognised as a 'hotbed' for earthquake activity, as demonstrated in Figure 2.
The reason for this concentration of earthquakes is its position at the junction of three tectonic plates—the Arabian, Nubian (African), and Somalian plates. This location contains the Afar Triple Junction, which is situated at latitude 11.30 and longitude 43.00, approximately 35 kilometres southwest of Djibouti City. Notably, all three major earthquakes (magnitude 6.2–6.5) between 1989 and 1992 occurred within 140 kilometres of the Afar Triple Junction (see Figures 3–4), and Figure 2 highlights a strong clustering of large events around this point.
The three arms of the Triple Junction—the East African, Red Sea, and Aden Rifts (Figure 3)—are said to diverge at near-perfect 120-degree angles from each other. Despite this geometric arrangement, the primary focus is on identifying the locations where the most significant earthquakes occur.
Most of the important earthquakes in this region are confined to the Afar Triangle (aka the Afar Depression): their spatial and temporal distribution, as well as population dynamics, are the central subjects of this investigation. The goal is to develop practical early forecasts of large seismic events, with the aim of safeguarding lives and property.
Figure 1.
Sequence of Major Earthquakes
Figure 1 illustrates the sequence of the largest annual earthquakes recorded since 1989 within the 'Afar Triangle' and its surrounding areas, as defined by specific geographic coordinates. This sequence offers valuable insights into the temporal changes and patterns of seismic activity across the region.
Analytical Modules and Ecological Model
Seven distinct yet interconnected Analytical Modules have been utilised to estimate the magnitude of the anticipated mainshock in 2026. Each module assesses earthquake dynamics and occurrences from a unique perspective, collectively contributing to a broader Ecological Model or Theory. Importantly, all modules deliver remarkably similar forecasts, underscoring the robustness of this analytical framework.
The M 4.3 mathematically critical precursor (PC) of 2016 is shown on the attached Google Earth image as just offshore of Djibouti and close to the M 5.4 foreshock of 2024. The general overall decline in the size of annual events between the mainshock of 1989, and the lowest point (the CP M4.3 of 2016) was significant (p <0.018), and the rapid rise following the 27-year decline is obvious, if not somewhat ominous.
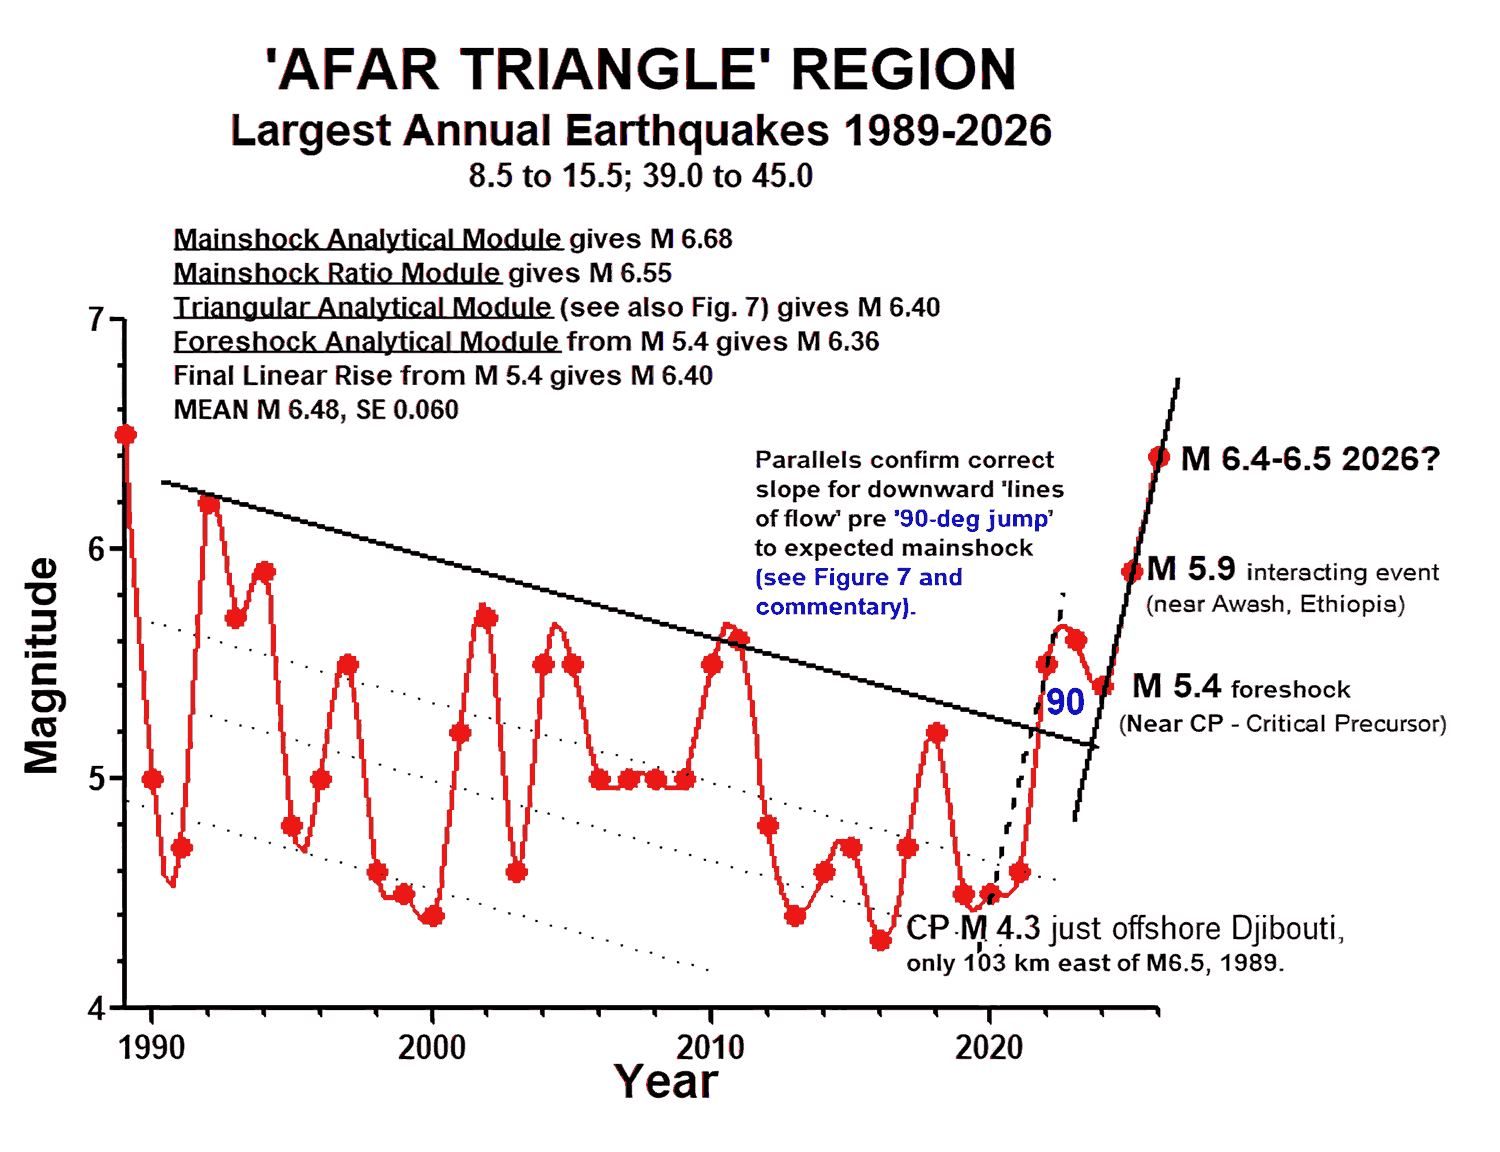
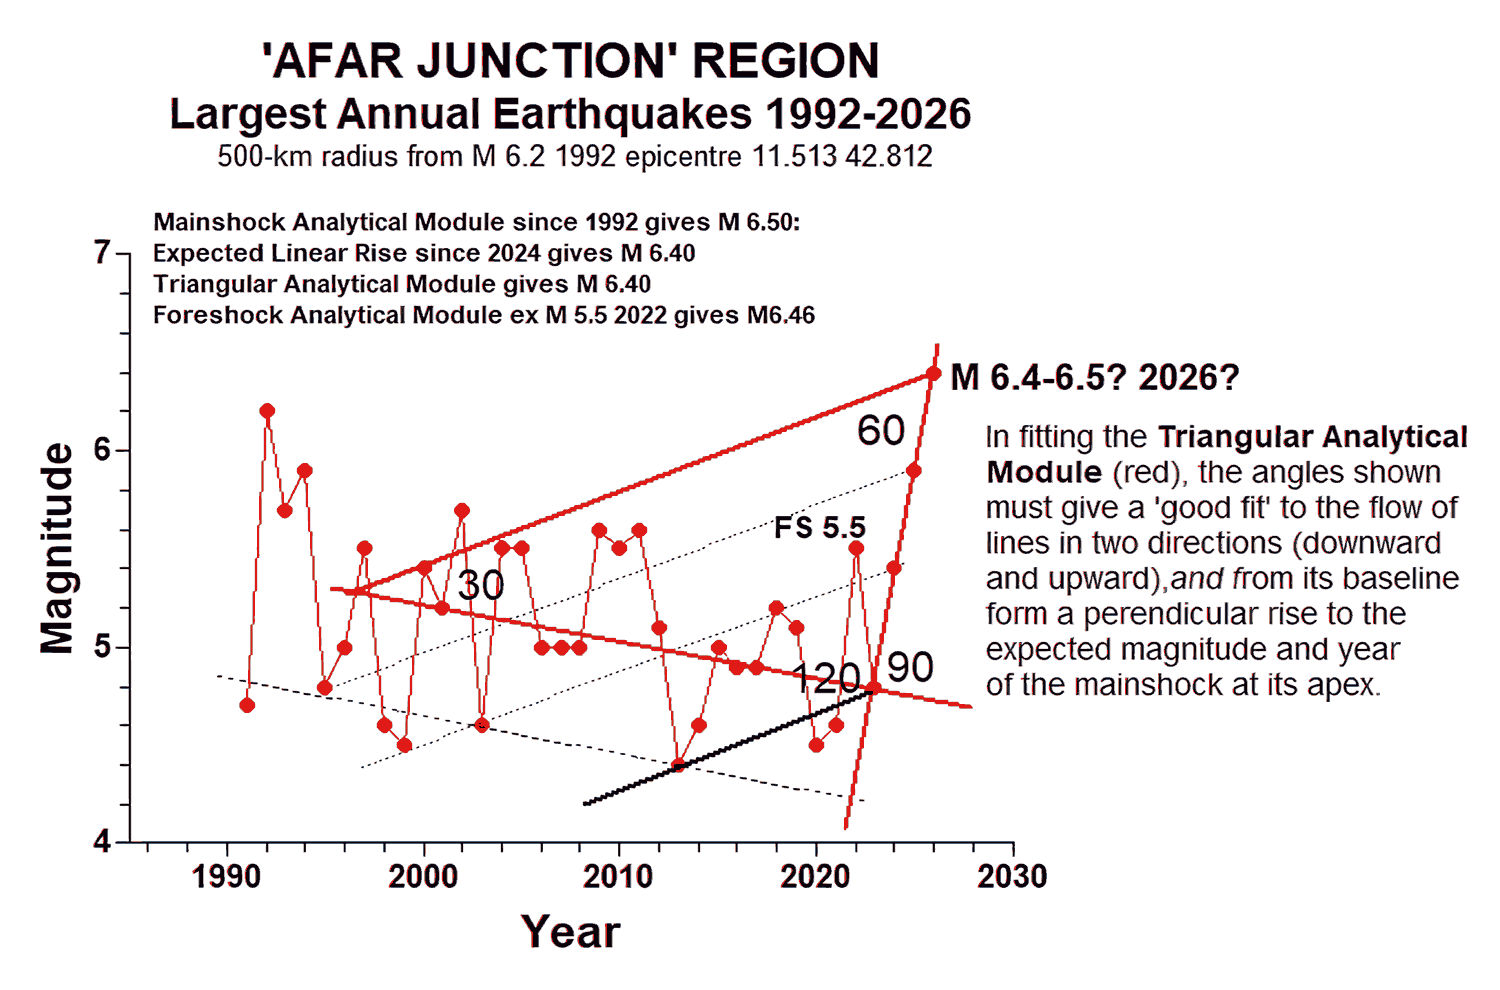
Figure 1b: Comparative Earthquake Sequence Analysis
Comparison with Afar Triangle Region
By comparison with the larger rectangular ‘Afar Triangle’ Region (as shown in Figure 1), this graph presents the sequence of the largest annual earthquakes within a smaller, circular region measuring 500 km in radius, centred on the M 6.2 event of 1992, which occurred just 38 km west of Djibouti City. This comparison highlights the robust nature of the Mainshock Analytical Module, which provides very similar forecasts for the next mainshock.
Critical Precursor and Triangular Module Fitting
In this second graph, the mathematically Critical Precursor (CP) was a M 4.4 earthquake in the Red Sea on 10/05/2013, approximately 368 km north of Djibouti City. The final 90-degree jump point was a M 4.8 event, located just 86 km east of Djibouti City.
It is important to note that the fitted Triangular Analytical Module does not operate independently. Therefore, even if it appears to fit a dataset, this does not necessarily indicate that a mainshock will occur at its apex—the point which represents a specific magnitude and expected time of occurrence. However, the corollary applies: if the module does not fit the data, the forecast is incorrect. This observation holds for retrospectively tested mainshocks, and the module’s application is currently being evaluated in a prospective context.
“Seeking when of an earthquake will hit is akin to forecasting a cyclone's landfall — the twists and turns need re-assessment”
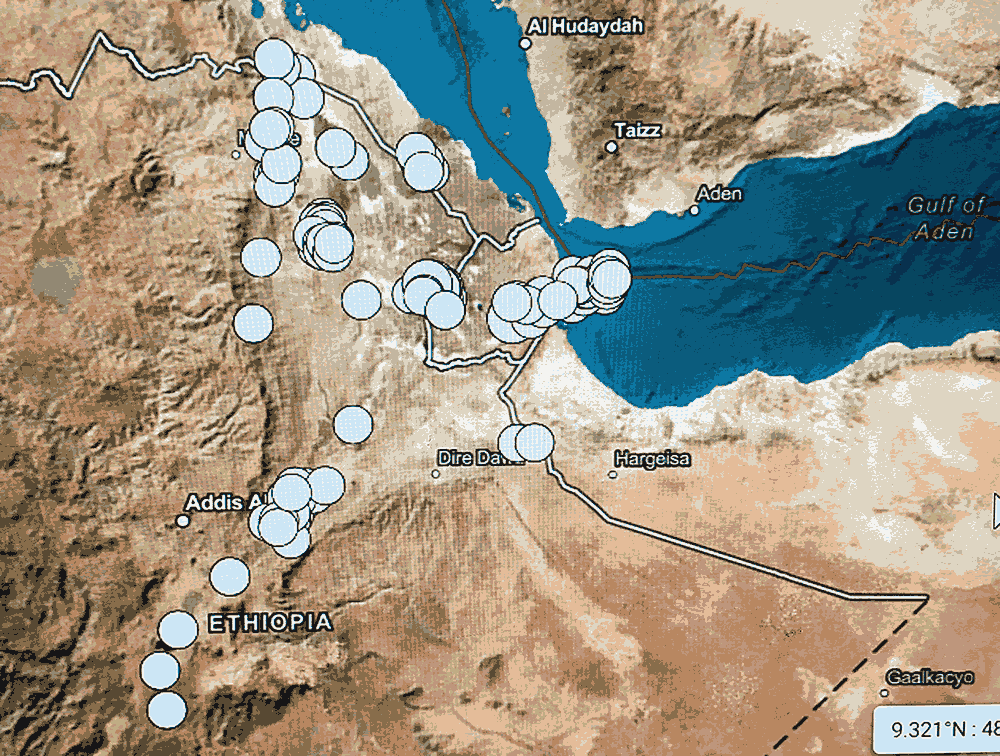
Figure 2.
This USGS Earthquake Search image shows the distribution of 123 M 5.0 and greater events since 1989 in the Afar Triangle region which is also known as the ‘Afar Depression’ by earth scientists. Mouse-over figure 2 →
(https://en.wikipedia.org/wiki/Afar_Triangle).
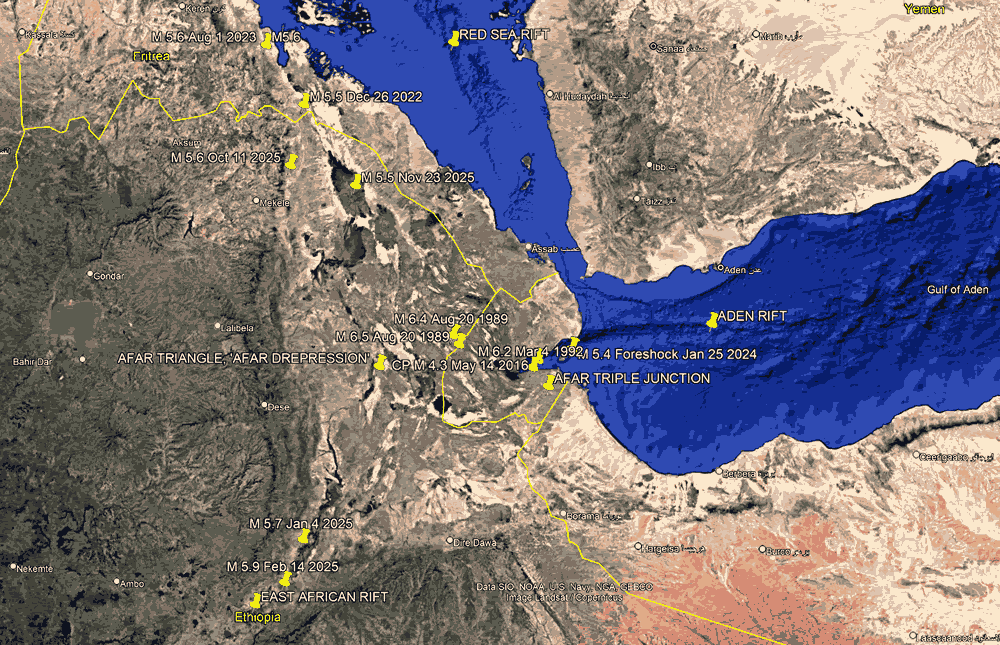
Figure 3.
This image of the Djibouti region shows the locations of important earthquakes relative to both the 1989 M 6.5 mainshock and the current expectation for M 6.4-6.5 earthquake within around the next 30 days [this update as of Apr 15, 2026]. The view shows mathematically-critical precursors (CP) and foreshocks for both periods which are all offshore and close to Djibouti City, in the nearby Gulf of Tajura (see Fig. 4). Whereas all M 6 events are on land within 100 km of the coast. The CP events for both periods are of a very similar magnitude, as are the foreshocks. The next mainshock is also expected to match that of 1989”. [credits to Google Earth Pro and USGS Earthquake Catalogue].

Figure 4
This closer view of Djibouti shows more clearly the relative positions of important precursors and foreshocks preceding the mainshocks, as already outlined for Figure_3.
Figure 7.
The Triangular Analytical Module
& Mainshock Geometry:
‘The 90-degree Jump’
Mainshocks are characterised by a sudden large jump in size that is 2-3 magnitudes greater in size than the penultimate largest monthly or yearly event: a jump that occurs at about 90 degrees to a baseline or ‘line of fall’ representing the decrease from largest to lowest magnitude in the prior sequence of largest monthly or yearly earthquakes, as for the twelve months preceding Djibouti’s M 6.5 of 1989 (Figure 7).
This graph offers the clearest illustration yet of the author’s so-called ‘90-degree jump’ in mainshock geometry. More than thirty global mainshocks have now been re-examined for this intriguing and highly significant aspect of earthquake dynamics, with further insights to be highlighted on this website.
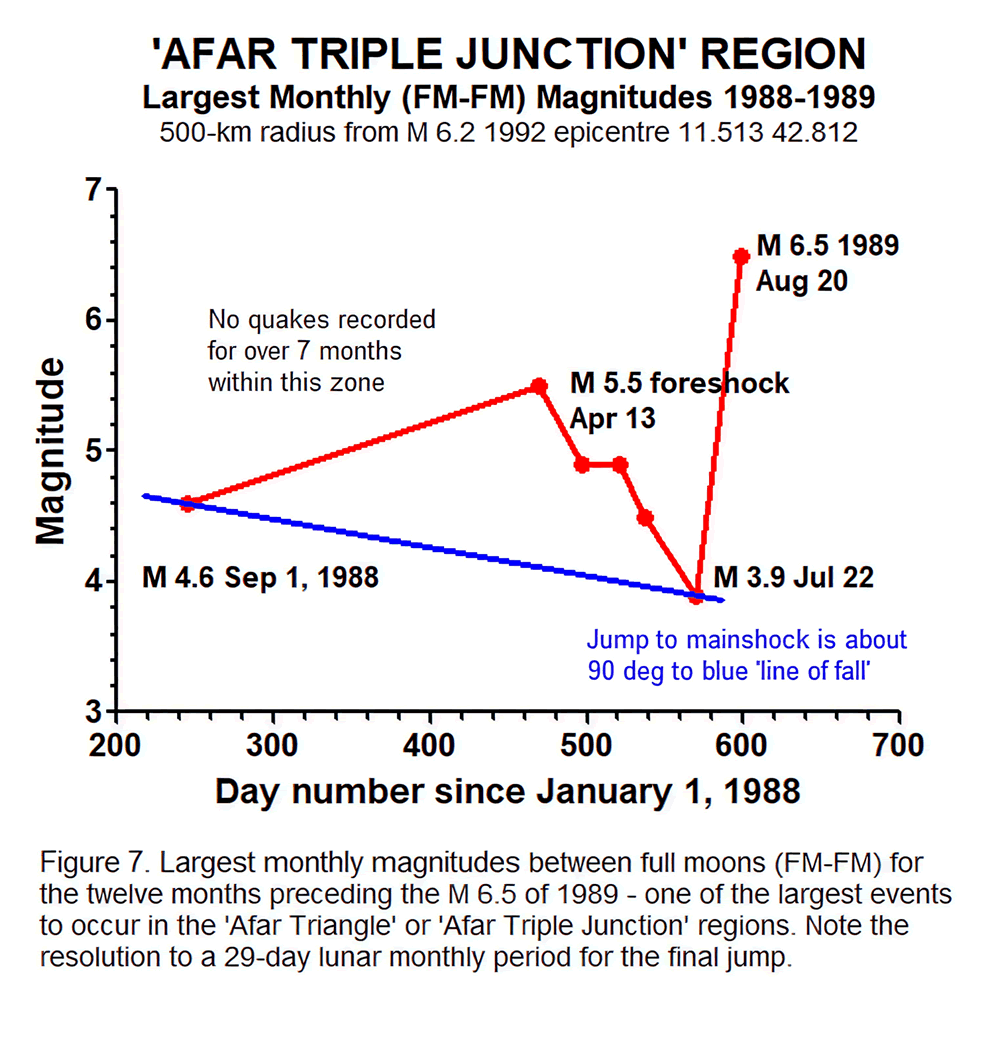
Figure 7 presents compelling graphical evidence of the underlying seismological processes. For instance, it reveals an extended seven-month period without any recorded quakes, suggesting that the rocks along fault lines were completely locked. Following this quiet spell, there was a notable decrease in large quakes over the ensuing three months. This pattern continued until the magnitude 3.9 event on July 22, which became the precursor to an unexpected surge in energy release—culminating in the M 6.5 mainshock on August 20, 1989, just 29 days later.
The ‘90-degree jump’ serves as both an additional forecasting tool and a means of cross-checking other predictive models, all of which must align on the expected magnitude and timing. Initially, the unpredictable nature of the 90-degree jump obscured its potential; however, by September 4, 2025, its geometric consistency became apparent, corroborating the forecasts produced by other modules for forthcoming mainshocks. Caveats relating to use of the '90-degree jump' are given on the page for the Triangular Module.
This website is dedicated to sharing the fascinating and revealing earthquake dynamics and behaviours that can be discerned from just three basic parameters: magnitude, timing, and location—data accessible to any interested student. Many of these patterns, including the emerging geometric framework presented here, represent novel insights that have seldom, if ever, been explored as the mathematical foundation for research with an ecological perspective. The recurring patterns and synchronies uncovered possess a remarkable mathematical elegance and an impressive level of predictive power.
Importantly, the predictive strength of this modelling does not hinge on any single event, pattern, or location. Instead, it arises from the integration of all observed patterns, analyses, and modules working together.

Forecasts Based on Revised Modelling
Every large earthquake provides an important opportunity to test understanding of these seismic events and to test the research modules that the author of this website has created and is constantly improving to help in anticipating the magnitude and timing of these often-devastating events, with the altruistic aim of saving lives and property.
Recently, the spatial distribution and timing of earthquakes in the Djibouti region have led to two improved approaches to modelling these events:
Firstly, the need to compare modelling outcomes from zones of greatly different areas, with preference for circular zones including ‘the entire region’, rather than rectangular zones.
Secondly, be aware of unexpected quakes of lower magnitude that can occur late in a sequence just prior to a mainshock and thereby making an earlier forecast invalid. It is hoped that this potential problem is obviated by the latest application of the Triangular Analytical Module (19 June 2026) which is now being tested with the late forecast below.
Updated forecast for Djibouti and Gulf of Aden: M 6.5-6.6 June 21-22.


Page latest update June 20, 2026
Sources:
- www.researchgate.net, www.volcanocafe.org, Afar Triangle -
Wikipedia and USGS Earthquake Catalogue, Google Earth Pro.
**Data were analysed with a spline curve generated using GraphPad Prism version 5.01 for Windows, GraphPad Software, San Diego, California USA, https://www.graphpad.com