
Japan
Japan Mainshock Forecasts
Northern Honshu
Official research shows that a megaquake is likely to hit Northern Honshu in the near term and Japanese authorities have already warned their people to be prepared (Megaquake advisory ended in Japan, but officials say disaster risk remains | NHK WORLD-JAPAN News).
From independent research, https://www.mainshockearthquakes.com, this author forecasts a possible M 8.3-8.7 megaquakebetween June 20-29, with much greater than 95% probability that it will hit on June 22, according to this new research below which is being tested.
A breakthrough in application of the Triangular Analytical Module for forecasting has been made because of recent events, and the previous methods for applying this module should be disregarded.
Explanation and Discussion of the Triangular Module
The Triangular Analytical Module was formulated from the important angles and lines that are demonstrated in the graphs below, and from research for other regions. Figures 1-5 compare past and present patterns for largest yearly and monthly earthquakes within a radius of 500 km from Northern Honshu's M 9.1 of Mar 2011.
The Module demonstrates how simultaneous geometric triangulations provide accurate retrospective forecasts for Japan’s previous mega-earthquake compared with new prospective forecasts, yet to be tested, from a corresponding study of current earthquakes.
Key features of the new Triangular Analytical Module are given below Figures 1-5 and show the potential ability to forecast both the timing and the magnitude of a forthcoming mainshock from two simultaneous triangulations in one geometric module, and with potential confirmation from annual and monthly modules.

Figure 1.

Figure 2.
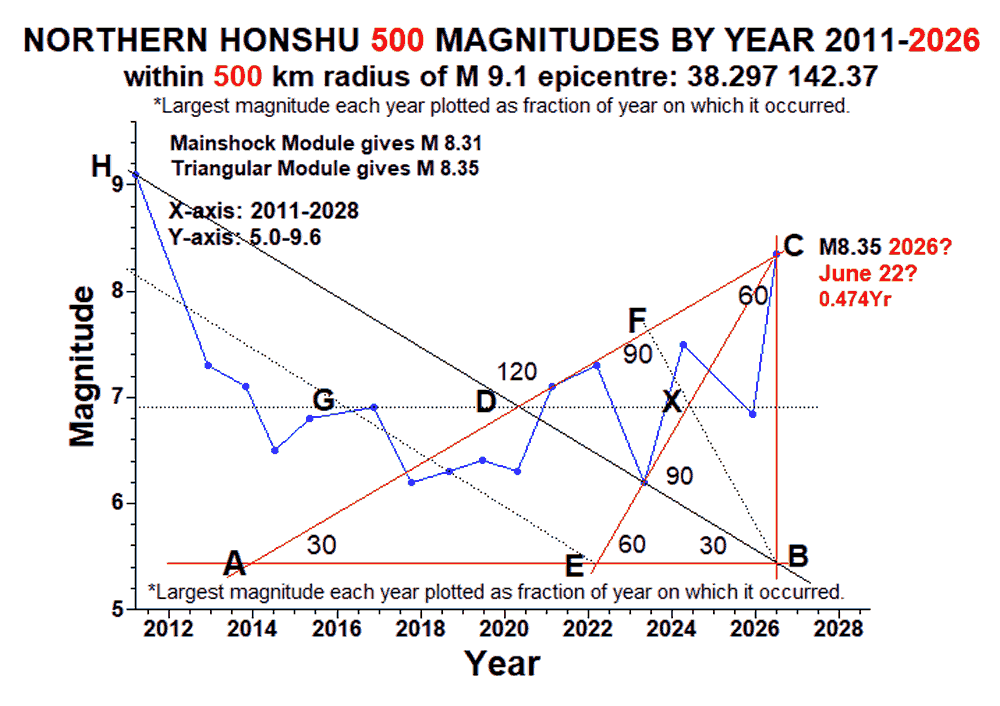
Figure 3.

Figure 4.
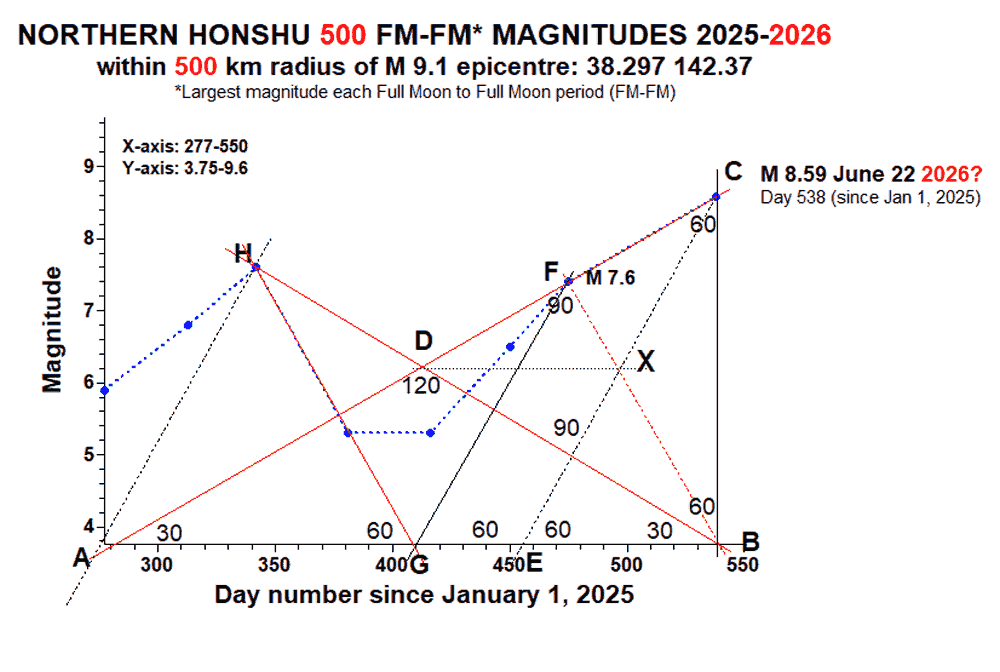
Figure 5.
Mainshock’s Date and Magnitude
Key features of the new Triangular Analytical Module are given below and show the potential ability to forecast the timing and magnitude of a forthcoming mainshock from two simultaneous triangulations in one geometric module, and with potential confirmation from annual and monthly modules.
Mainshock’s Date & Magnitude given simultaneously by two triangulations:
The Date of a Mainshock is given by triangulation at B on the baseline.
a) The date B for the next mainshock is given by where DB intersects base AB.
b) The line FXB (theoretical or not) must intersect the baseline at B.
c) At the intersection of the perpendicular CB which forms the 60-deg angle ACB subtended from C.
The Magnitude of a Mainshock is given by triangulation at C on the apex.
a) On a 30-deg rise from baseline AB to C and often including a major foreshock.
b) At the intersection of AC & EC, the latter being either theoretical or actual and arising at an angle of 60 degrees from AB to join C. Major foreshocks may also occur on EC.
c) At the intersection with the perpendicular BC from the appropriate date B.
Axes are adjusted so that AC & DB, by triangular theory, form 30-deg angles with AB and thus 120 degrees at D; then, the intersection of DB and AB gives the date (day number) of the mainshock at C which subtends the 60-deg angle ACB. When the axes are being adjusted, DX is important as it should intersect where EC and FB cross over, whether these lines are theoretical or not.
The 60-deg angle ACB is divided by EC which crosses the important line DB at an angle of 90 degrees and as shown in Figures 1-2, EC arises from baseline AB where it is intersected at 90 degrees by GE. Horizontal lines HF and GX highlight key intersections through which theoretical lines can be drawn if data are lacking.
NB: This page’s content is currently being updated.
Latest page update June 12, 2026 (UTC).