
Tonga
Photo by Nandeenee Naiken on Unsplash
TONGA: An M 8.2 +/- 0.3 is likely around May 16-19, 2026, within a 350-km radius of Pangai, Tonga, according to updates of the analytical research modules presented on this website as components of a new Ecological Model to anticipate the magnitude and timing of mainshock earthquakes
The largest recent earthquakes within 350 km of Pangai (2022-2026) were an M 7.3 in 2022 (236 km east of Pangai), an M 7.0 in 2025 (60 km south) and an M 7.5 on Mar 24, 2026 (186 km northwest of Pangai). These earthquakes are shown below on the Google Earth Pro map in relation to Tonga’s previous M 8.0 of 2006.
Information regarding the M 8.0 great earthquake of May 3, 2006, is available on the USGS network: M 8.0 - 47 km SSE of Pangai, Tonga: “At the location of the earthquake, the Pacific plate subducts westward beneath the Australia plate at a velocity of about 77 mm/yr”. This USGS site also says that a tsunami with wave height of 0.54 metres hit at Pago Pago, and that this peak was also reached at Crescent City, California. Fortunately, no loss of life was recorded, and only one person was injured.
This page is being updated
〰️
This page is being updated 〰️
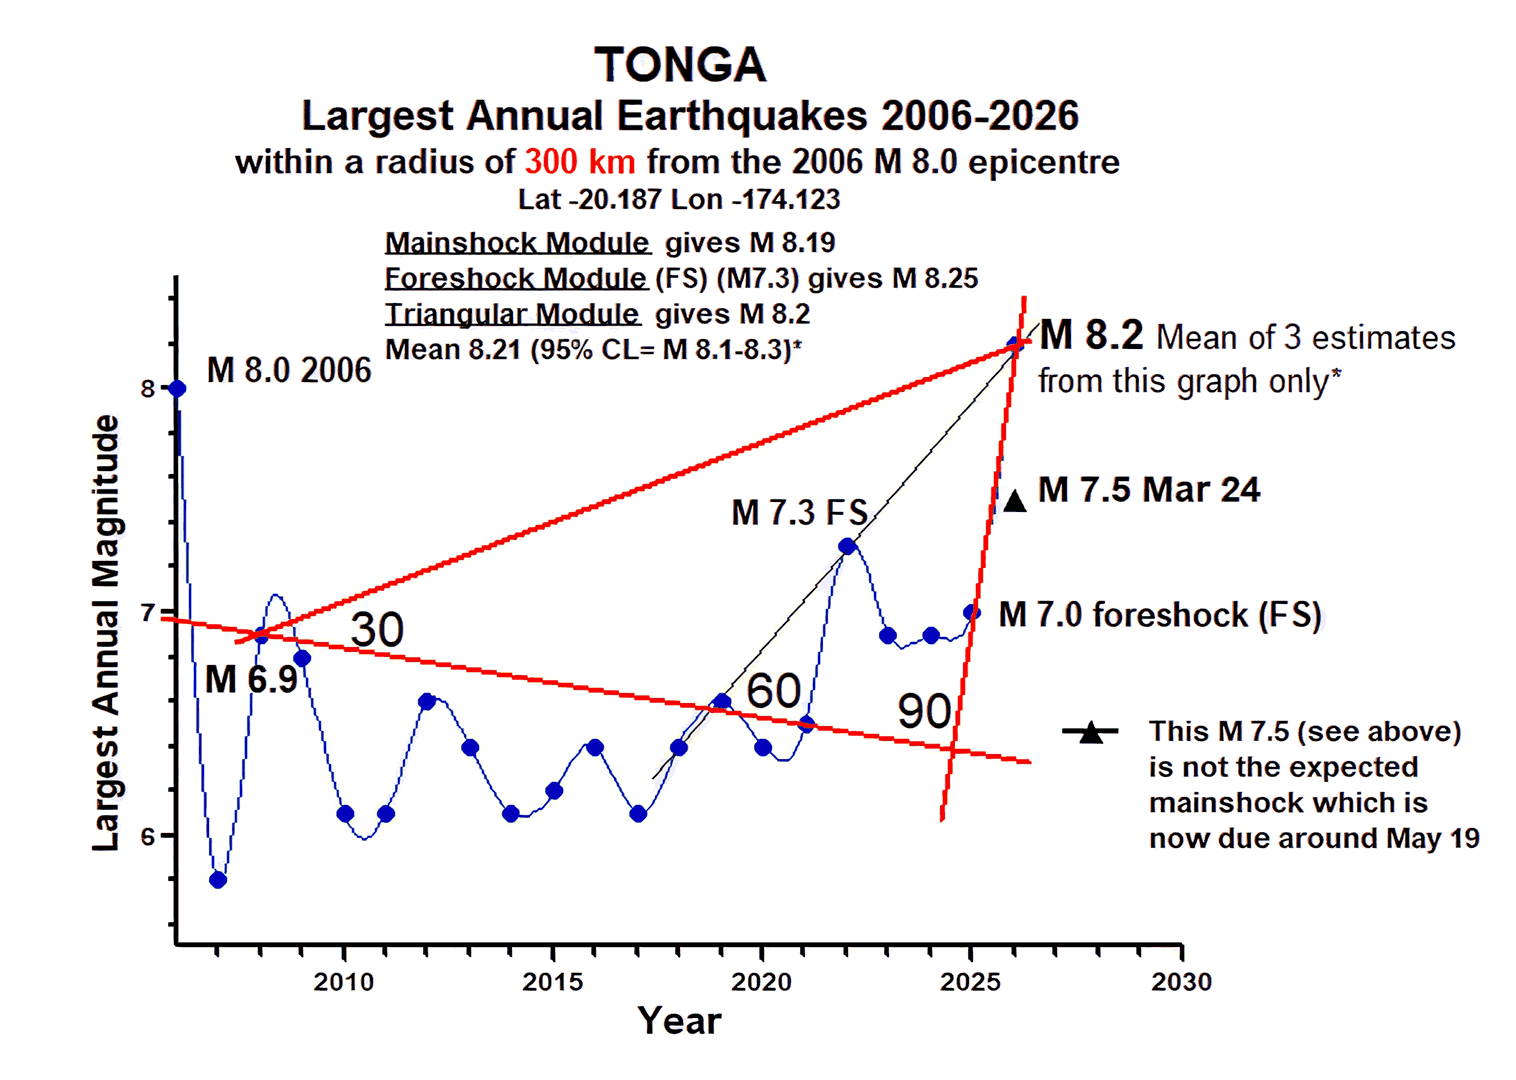
Figure 1.
Figure 1. Sequence of largest annual seismic events within 300 km of Tonga's M 8.0 in 2006, which provides the basic data for the Mainshock Analytical Module, and with the angles of the Triangular Analytical Module (red) superimposed on the graph for more clarity of that module which is being tested (angles are approximate). Together with the Foreshock Analytical Module this figure provides three separate estimates for the size of the forthcoming mainshock, as listed on the graph: their mean isM 8.21* and the 95% Confidence Limits (CL) are M 8.1-8.3.
*It is important to note that the final estimates of magnitude and timing are based on all the means (like the M8.21 above) acquired from a variety of different analyses, including different time periods and regions.
This and all subsequent graphs are done with GraphPad Prism and Spline analysis** used to fit smooth curves to the largest earthquakes in each period to stress the importance of 'flow' in understanding the population dynamics of earthquakes and the ability to forecast them.
**Data were analysed with a spline curve generated using GraphPad Prism version 5.01 for Windows,
GraphPad Software, San Diego, California USA, https://www.graphpad.com
This kind of graph is closely similar in format and concept to those of my previous career as an insect ecologist where, instead of the largest earthquake in a given time period, I was studying the maximum abundance of certain insect species each year as a result of different pasture grazing management practises. This simple approach led to a worldwide breakthrough which overturned conventional thought and expectations and made it possible to understand several previous conundrums in the dynamics of pasture pest problems throughout the world.
Well might you have asked: ‘What have insects to do with earthquakes?’ Nothing. and ‘What have earthquakes to do with insects?’ Nothing. Certainly not in this context here. But the ways an ecologist might go about modelling their population dynamics and features of their ecology are very similar.
Author's previous retrospective forecast for the M 8.0, 2006
This new ecological forecasting model gave the exact magnitude and date (May 3) for this mainshock which came, as expected, within 250 km of Pangai, Tonga. It occurred only 45 km SE of Pangai.
*If not stated otherwise, all earthquake data for the research and forecasts shown in this website were derived from the United States Geological Survey (USGS), and all times and dates are UTC.
This mainshock is imminent, but when?
—now likely as an M 8.2 ± 0.3 around May 16-19, 2026—
This page is being updated
〰️
This page is being updated 〰️

Figure 2.
shows the sequence of largest yearly earthquakes within a radius of 500 km from Pangai, prior to Tonga’s M 8.0 of 2006. This analysis provides an opportunity to test the forecasts given by various modules (as shown) against a large mainshock which has already occurred, and the results are excellent with a mean forecast of M 8.03 based on estimates from the Mainshock Module, the Triangular Module, the Ratio Module, and the Foreshock Module.
The Triangular Module must have the 30-, 60- and 90-degree lines converging at the M 8.0 and large ‘foreshocks’ must occur on the 30- and/or 60-degree lines, as shown. The baseline joins the perpendicular side of the triangle at its intercept on the x-axis, and joins the hypotenuse at its intercept on the y-axis.
Please note the important comments in the caption to Figure 1 which apply to all estimates.
Author's previous retrospective forecast for the M 8.0, 2006. [See Figure 2, above.]
Key Findings from Figure 2:
Mainshock Analytical Module Performance
The author's Mainshock Analytical Module is robust, producing an estimate for the magnitude of the 2006 Tongan M 8.0 mainshock that closely matches the actual value. This reliability is notable given the unpredictable variation in event sizes throughout the sequence, where each data point contributes to the mathematical and statistical analyses. These analyses are grounded in a conceptual framework inspired by Newton's principle: for every action, there is an equal and opposite reaction.
Identification of the Critical Precursor
The lowest yearly magnitude recorded in the sequence of largest earthquakes for each year—the M 6.1 in 2005—is designated as the author's mathematical 'Critical Precursor' (CP) for modelling purposes. This designation is also conceptually based on the Newtonian principle outlined above.
Mathematical and Spatial Importance of the Critical Precursor
The Critical Precursor is both mathematically and spatially important. It usually occurs within 250 kilometres of the subsequent mainshock. In this example prior to the M 8.0 of 2006, with a search zone radius of 500 km from Pangai, Tonga, the M 6.1 CP was located only 33 km southwest of the M 8.0 mainshock. However, adjusting the size of the search zone can alter the CP's position accordingly.
Position of the Critical Precursor in Aftershock and Foreshock Sequences
The Critical Precursor usually lies more or less at the divide between aftershock and foreshock magnitude sequences (like the M 6.2 of 2002), but the M 6.1 in the penultimate year of 2005 was the lowest point and therefore becomes the Critical Precursor (CP). The author’s studies of well over 100 inter-mainshock annual sequences have shown that the CP quake can occur at any time in a sequence, even in the year immediately following the previous mainshock in a specified region.
Magnitude Drop Prior to Mainshock
A strong drop in magnitude in the penultimate year is the norm, and this pattern is clearly demonstrated in the sequence analysed.

Figure 3.
This figure shows the current sequence of largest annual earthquakes within a radius of 500 km from Pangai, thus providing a direct comparison with the analyses of earthquakes leading up to Tonga’s M 8.0 of 2006. As noted, the same yearly magnitudes were derived from 500-km radius around Hihifo.
The mean value of M 8.28 for the magnitude of the forthcoming mainshock is derived from four separate estimates based on analysis of data in this single graph. As shown in red, The Triangular Module must have the 30-, 60- and 90-degree lines converging at its apex where the hypotenuse and perpendicular form a 60-degee angle: these converging lines give an independent estimate of M 8.35 from this single analysis, as shown, and this value is confirmed exactly from a linear regression through the three points now on the hypotenuse.
The 95% Confidence Limits (often abbreviated CL) for this forthcoming mainshock are M 8.15-M 8.4. The M 6.4 Critical Precursor (CP) of 2020 was used in the analysis for the estimate derived from the Mainshock Module, and the estimate derived from the Ratio Module was based on the ratio between numbers of M 5.0 to 5.99 divided by numbers of M 4.0 to 4.99 earthquakes within 1500 km of Pangai over just half a year to avoid other large earthquakes that lead to spurious or unrealistic results. The Ratio Module (as explained on that page) requires high numbers to be valid and so here that is achieved with a larger region to ‘balance out’ the smaller time interval.
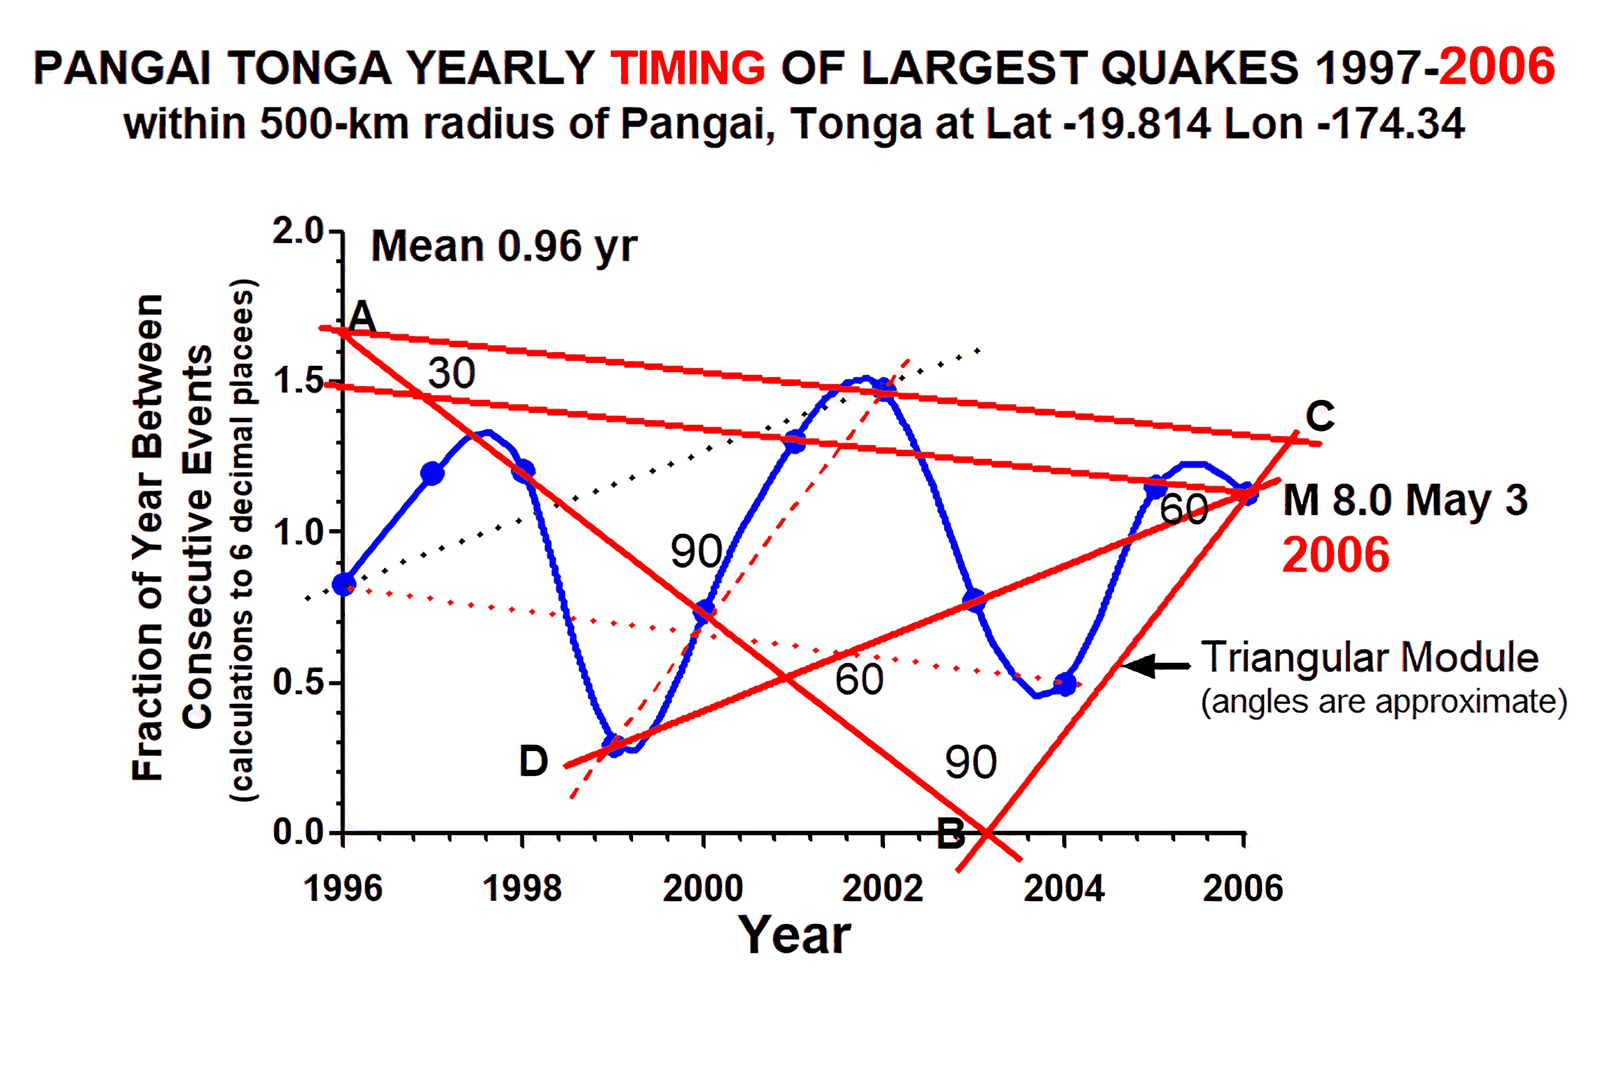
Figure 4.
This figure shows the flow of the time interval between the largest earthquakes in consecutive years within a radius of 500 km from Pangai, Tonga, at Lat -19.814, Lon -174.34. The timing between these earthquakes should theoretically average one year apart, as it does here closely with a mean of 0.96 years.
When a mainshock is imminent, the time intervals between largest earthquakes in consecutive years should also resolve towards ‘unity’ or one year apart. In this example, with a search zone of 500- km radius, the M 8.0 of 2006 occurred 1.134 years after the previous year’s largest earthquake. It is seen that three important lines are converging on 2006 for the M 8.0: the perpendicular rise BC, the 60-degree ‘foreshock line’ which is here originating at D, and the 30-degree line of the internal triangle which is parallel to AC.
There are several important parallel lines confirming the excellent degree of symmetry in the data for this region, and confirming the positioning of this important triangle. The Triangular Module here gives an excellent fit to the data and provides an unbiased determination of key points and lines, and a solution that establishes the M 8.0 in 2006.

Figure 5
This shows the TIMING of earthquakes in the Tongan region during 2018-2026 and provides a direct comparison with the previous graph (Figure 4) for the timing of earthquakes preceding Tonga's M 8.0 of 2006. As for Figure 4, this graph shows the flow of the time interval between the largest earthquakes in consecutive years within a radius of 500 km from Pangai, Tonga, at Lat -19.814, Lon -174.34. The timing between these earthquakes should theoretically average one year apart, as it does here precisely, and when a mainshock is imminent, these time intervals between largest earthquakes in consecutive years should also resolve towards ‘unity’ or one year apart. This is illustrated in Figure 5 where the amplitude of the curves, or time between consecutive earthquakes, is declining and reducing towards 'unity' - here reaching about 1.13 years since the previous year's largest earthquake, if the expected M 8.2 mainshock occurs around May 19, 2026, as seen in the next graphs (Figures 6 onwards).
The Triangular Module here gives an excellent fit to the data and provides an unbiassed determination of key points and lines, with the anticipated mainshock at the apex of the triangle where the perpendicular BC from the x-axis meets the hypotenuse AC joining from the Y-axis and describing the decline in the amplitude of the curves towards 'unity', or a little over one year between the timing of consecutive years' largest events. If the mainshock occurs on May 19, as graphed, the fraction of year since the previous event would be 1.139726 years.
This module, outlined in red, is comprised of two internal triangles: an equilateral triangle BCD, and the adjacent isosceles triangle ABD. The hypotenuse AC is divided equally at D - an important point (M 7.3 Nov 11, 2022) which is also at the divide between the internal triangles. The dotted parallel lines indicate a fair degree of symmetry in the data for this region, and confirm the positioning of this important Triangular Module.

Figure 6
This analysis of past magnitudes occurring as the largest half-monthly earthquakes in the New Moon to Full Moon intervals (NM-FM) for 15 months preceding Tonga’s M 8.0 in 2006 (within a radius of 500 km from Pangai, at Lat -19.814, Lon -174.345) provides a direct comparison with the following graph of current earthquakes in the same region leading up to an approximate M 8.2 that has been forecast on this website as likely to occur around May 16-20, 2026.
The mean value of M 8.13 (Figure 6) for the likely magnitude of Tonga’s M 8.0 mainshock of 2006 was acquired from three separate estimates based on analysis of past data in this single graph. As shown in red, The Triangular Module must have the hypotenuse AC converging to meet the perpendicular BC at its apex where the hypotenuse and perpendicular not only form a 60-degee angle, but they must do so precisely at the forecast magnitude and date (day number). Additionally, the fitted baseline (AB) should describe the downward flow in the size of events prior to the sudden 90-degree jump to the mainshock, and the hypotenuse AC (or a line parallel to it) should contain important ‘foreshocks’ like the M 7.2 of Jan 2, 2006.
M 4.8 Critical Precursor (CP) of Feb 10, 2005, was used in the analysis for the estimate derived from the Mainshock Module. This quake occurred some 265 km SSW of the subsequent M8.0 on May 3, 2006. It is interesting to note that the Mainshock Module was initially developed to apply in analyses of the largest inter-mainshock yearly magnitudes, but so far it has been proving equally good for forecasts based on monthly data – as here over a period of 15 months prior to the M 8.0 in 2006.
Of particular interest is the strong perpendicular rise to the M 7.2 (shown on a line parallel to AC), followed by a sharp 40-degree fall in the size of quakes down to the M 5.3 (Apr 3) jump-off point for the mainshock - where a 50-degree angle is noted: in addition to ‘30-60-90 degree’ triangles, ‘40-50-90 degree’ triangles may well be important in describing important patterns in the geometry of earthquakes.

Figure 7
The majority of discussion about Figure 6 also applies to Figure 7, except that the latter figure has three lines converging at the magnitude and date expected: the hypotenuse AC, the 60-degree foreshock line DC, and the 90-degree rise BC.
There is also a very interesting similarity in both figures with strong vertical rises to large ‘foreshocks’ parallel to the rises to the past M 8.0 and the forthcoming event.
Failure of the Mainshock Module to give a good result with monthly data will require further study, but may well be related to use of half-monthly data instead of full monthly data.
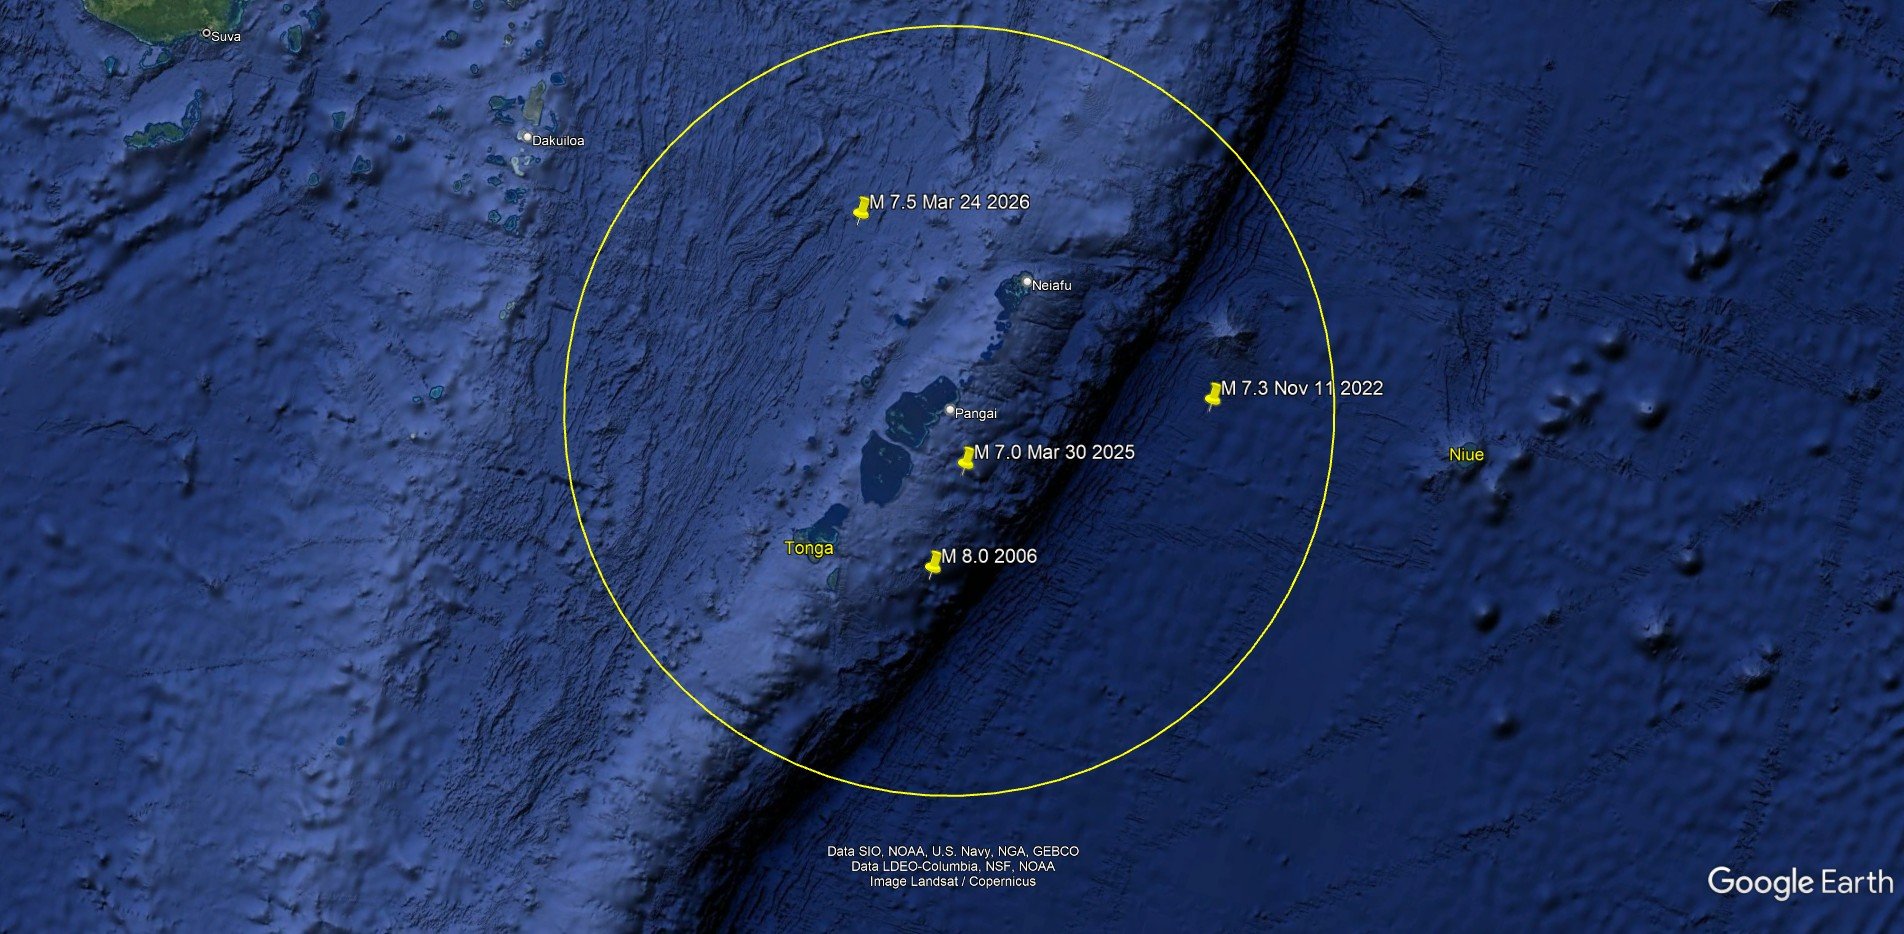
Google Earth Pro map showing the location of the largest recent earthquakes in relation to the previous M 8.0 of 2006, within a radius of 350 km from Pangai, Tonga. https://earthquake.usgs.gov/earthquakes/map/
**Data were analysed with a spline curve generated using GraphPad Prism version 5.01 for Windows, GraphPad Software, San Diego, California USA, https://www.graphpad.com
This page is in process of being updated…
Latest update: 15 May, 2026.