
HINDU KUSH & WEST HIMALAYAS
Introduction
The Hindu Kush region of north-eastern Afghanistan is at the western end of the Himalayan mountain ranges, as shown in the attached Google Earth Pro image. The Hindu Kush earthquake of 2015 struck at a depth of 231 km and affected a wide region of Afghanistan, Pakistan and India. At least 399 people were killed (mainly in Pakistan) and 2536 injured in this seismologically extremely active region due to the Indian Plate pushing under the Eurasian Plate - the same tectonic action that has produced the Himalayas (October 2015 Hindu Kush earthquake - Wikipedia).
The study zone for the graphs below has a radius of 350 km around the epicentre of the 2015 Hindu Kush earthquake. A USGS catalogue search (Search Earthquake Catalog) reveals that since 1900 this 350-km zone has endured 17 earthquakes of M 7.0-7.8, while increasing the zone to a radius of 500 km added only three more events. However, one of them was the deadliest regional earthquake - the M 7.6 "Kashmir Earthquake" of Oct 2015 (2005 Kashmir earthquake - Wikipedia) which may have killed over 100,000. Although it occurred only some 378 km southeast of the 2015 Hindu Kush earthquake as assessed from the Google Earth Pro image below, the author bases separate studies of regional earthquake dynamics centred on this Kashmir region.

Credit: Google Earth Pro map
This Google Earth Pro image shows the author's study zone (radius 350 km) centred on the 2015 Hindu Kush earthquake in north-eastern Afghanistan and at the western end of the Himalayas.
Discussion
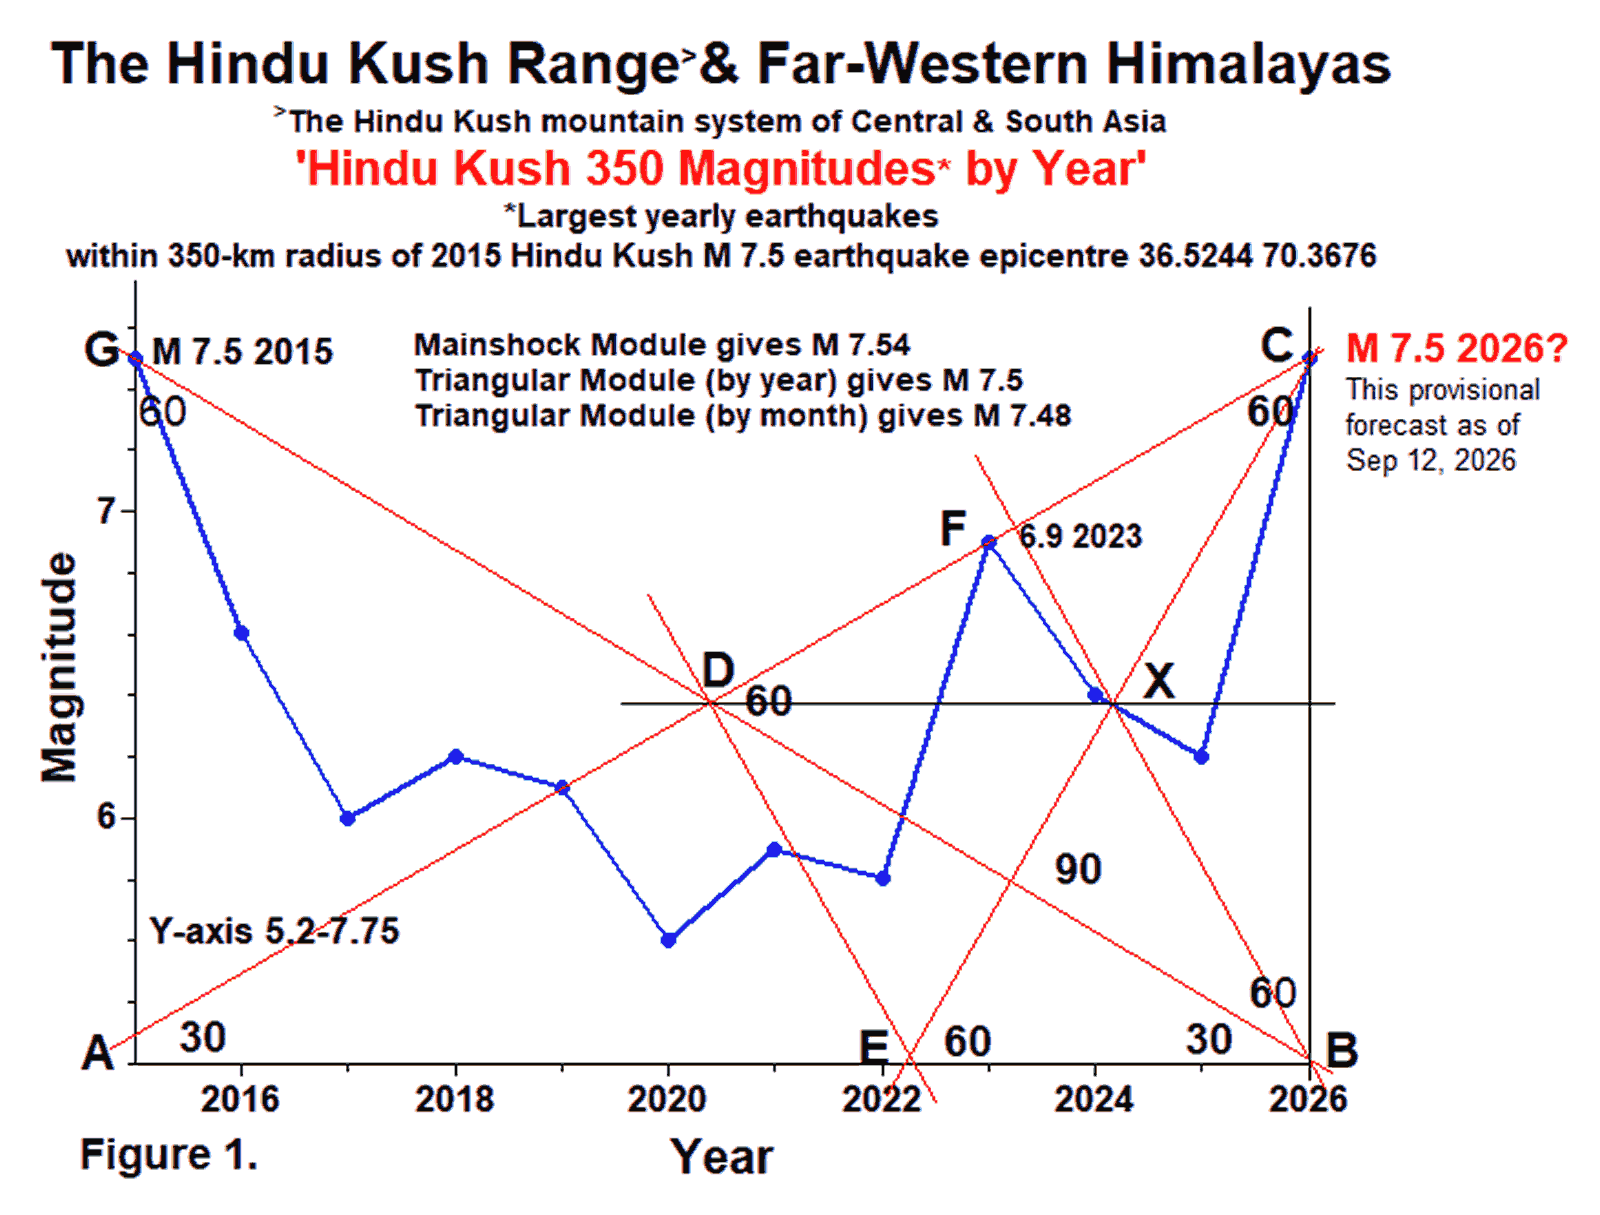
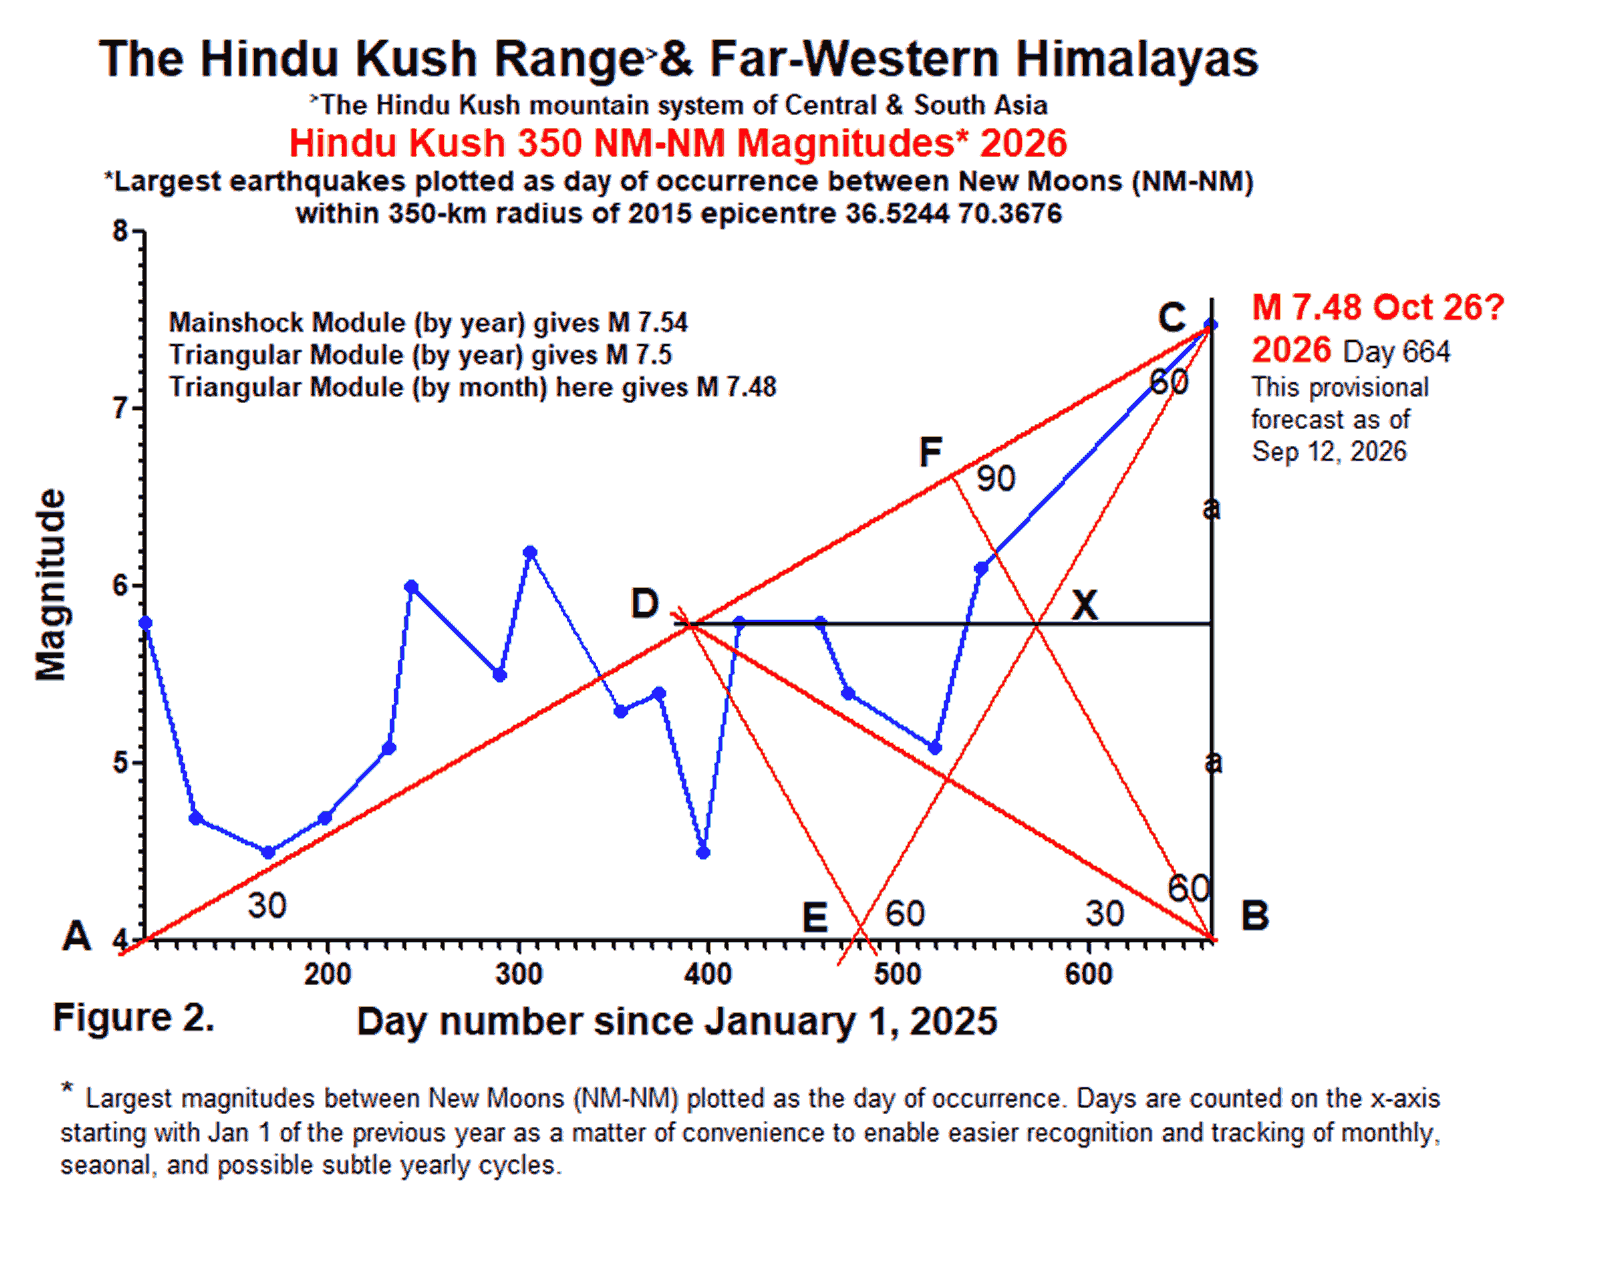
From the revised Figures 1-2 it appears that there is about to be a recurrence of the M 7.5 Hindu Kush earthquake mainshock of 2015. This event is likely to occur around Full Moon on Oct 26, 2026, based on data to this point in time (Figure 2), as modelling will not be updated again (if needed) until mid Oct 2026.
Previously this earthquake was thought likely by early Sep 2026, but the revised modelling here yields stronger agreement between ‘best fits’ of the Triangular Module to both monthly and yearly data sets. Also previously Figure 1 was presented with all events plotted as the fraction of a year on which they fell, but this technique provided no additional advantages and has been discontinued.
According to the theory behind the Triangular Module, line GB (Figure 1) notionally represents descending values in the sequence and must subtend an angle of 60 degrees with line AG; then its intersection at B with baseline AB gives the expected year of a forthcoming mainshock, here being 2026.
The ascending values of the sequence are represented by line AC which in Figure 1 is placed to pass through a major M 6.9 ‘foreshock’ on its way to the projected and forecast mainshock of M 7.5 in 2026. Again, by theory, line AC must form a 30-degree angle with baseline AB, or its extension as in this case. Also, line EC must form a 60-degree angle with AB. Then triangulation of AC, EC, and BC at C confirms M 7.5 as the expected magnitude. There must also be simultaneous triangulation at cross-over point D where AC, GB, and DX intersect, the latter bisecting line BC.
These same principles apply to Figure 2 where the largest earthquakes are plotted on day of their occurrence between New Moons (NM-NM) within a 350-km radius of the Hindu Kush earthquake of 2015. This technique also provides the assessment that the next mainshock is likely to be a M 7.5 event and it gives the approximate date of Oct 22, 2026, at around Full Moon.
Page updated Sep 13, 2026